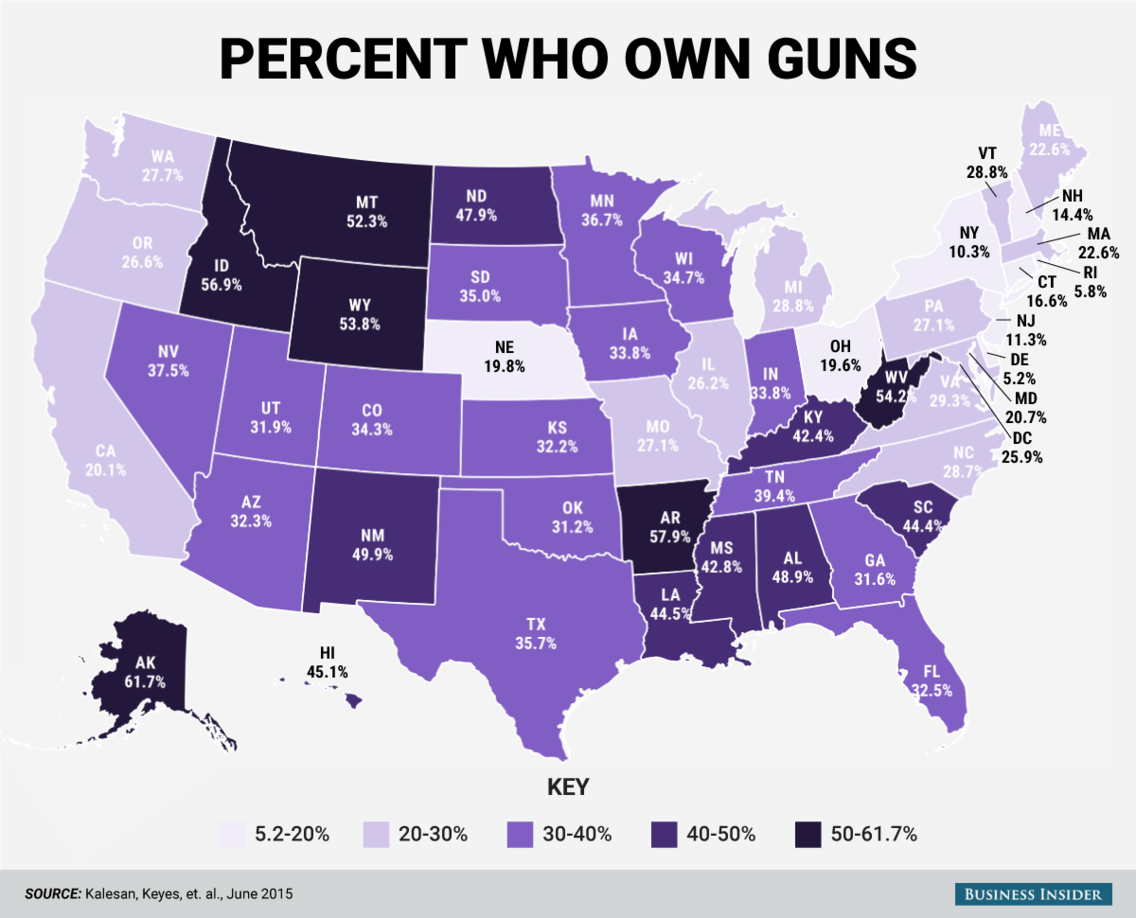
At r/DataIsBeautiful, academiaadvice posted this map of U.S. gun homicides per 100,000 residents between 2007-2016. Source: U.S. Centers for Disease Control and Prevention – https://wonder.cdc.gov/ucd-icd10.html – Tools: Excel, Datawrapper. Rates are expressed on an annual basis, covering the years 2007-2016. Raw CDC data By comparison, here’s gun ownership rates: Idaho’s relatively low gun homidice rate (about 1.2 per 100k) still outstrips those of heavily urban democracies like the UK (0.23) and Japan (0.1). The variation within U.S. regions conceals the general scale of the killing on a whole (5.3 per 100k). And that particular number excludes about half the gun deaths in America—gun deaths that are as less likely elsewhere as the homicides are. One we decide to ignore the obvious correlation — absolute thresholds of gun owenership and availability — the more significant obscure ones become. Source: https://boingboing.net/2018/02/15/gun-killings-map-of-america.html Tags: *Headlines*, #Headlines, #TheNewz, Guns and Weapons | #Guns, random, #TopNews, #Trending
Original Post: https://droolindog.net/2018/02/15/gun-homicide-rate-map-of-america/
Original Post: https://droolindog.net/2018/02/15/gun-homicide-rate-map-of-america/
No comments:
Post a Comment